Predicting Covid-19 Cases with a Long Short-Term Memory Neural Network(LSTM)
Covid-19 in the U.S.A. has been a difficult battle despite some of our best efforts. However, this is also a good opportunity to speculate with the data we are given. In previous articles, we have analyzed different machine learning models for forecasting Covid-19 cases. We will go over the details of using a long short-term memory (LSTM) network in MATLAB to find the most appropriate model using the the total number of cases reported in the U.S.A.
Building the LSTM
An LSTM network is a specific kind of recurrent neural network (RNN). For example, when we want to make a forecast of Covid-19 cases, the prediction on the 5th day away is dependent on what we predicted for days 1-4
in addition to the original data we trained over. We will not go too much in depth on the underlying equations involved in the LSTM network, however it can be found in the MATLAB documentation
here. Each prediction we make is influenced by the order of the days.
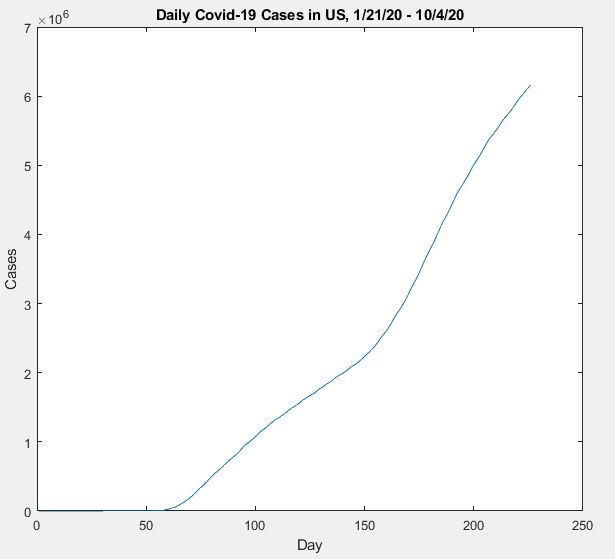
First, we load the data starting from the first case reported on 1/21/20 up to 9/2/20. We will use the remainder of the data from 9/3/20 to 10/4/20 to test the validity of the model. After training, we will update
the model with the additional data and see how it improves. We uploaded a csv file which is publicly available from US Covid-19 data.
% Import data from CSV
opts = spreadsheetImportOptions("NumVariables", 1);
opts.Sheet = "Sheet1";
opts.DataRange = "A2:A227";
opts.VariableNames = "VarName1";
opts.VariableTypes = "double";
CovidData = readtable("H:\School work\Covid Project 2020\US_COVID.xlsx",... opts, "UseExcel", false);
CovidData = table2array(CovidData);
CovidData = transpose(CovidData);
figureplot(CovidData)
xlabel("Day")
ylabel("Cases")
title("Daily Covid-19 Cases in US, 1/21/20 - 10/4/20")
Now, we want to partition the data so that the last 30 days will be tested. The other 85% of the days we train over should give a strong model which will pick up on any inherent characteristics and trends in the data. Additionally, we want to standardize the data to remove any unit effects. The data is now easier to work with and we can set the independent variable and the dependent variable to train.
% Partition Model
TimeStepsTrain = floor(0.865*numel(CovidData));
TrainingData = CovidData(1:TimeStepsTrain+1);
TestingData = CovidData(TimeStepsTrain+1:end);
% Standardize data
mu = mean(TrainingData);
sig = std(TrainingData);
StandardizedTrainingData = (TrainingData - mu) / sig;
% Prepare predictor
XTrain = StandardizedTrainingData(1:end-1);
YTrain = StandardizedTrainingData(2:end);
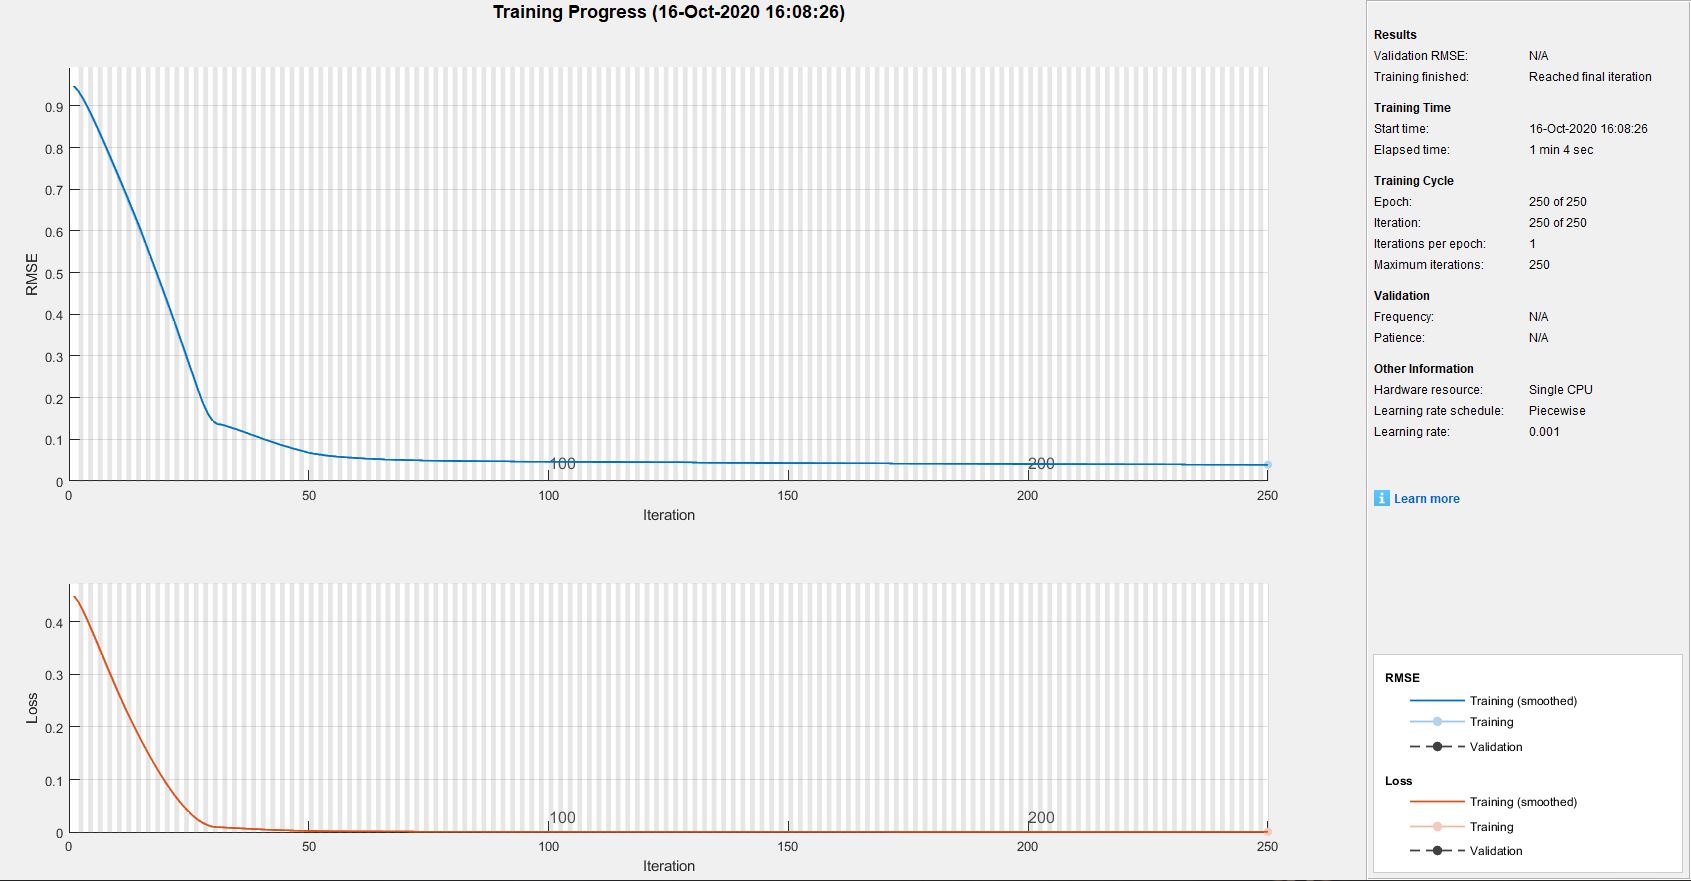
Once the data is ready, it's time to prepare the details to the LSTM network. Since our only input is the date of the day itself, our input feature is only a value of 1. The output of the measured number of Covid-19 cases to is also marked as a 1. The hidden units essentially connect the features to the responses and handle the actual neural networking. These details can be found in the MATLAB documentation. While having a high number of hidden units can increase the accuracy of the model, we don't want to overfit the data to have a perfect model, thus we found that 200 is a optimal amount. Any additional tweaks can be made to the features during the training of the LSTM network. In our case, the model converged after only 30 iterations and does not need changes in any of the learning features.
% Define LSTM network
Features = 1;
Responses = 1;
HiddenUnits = 200;
% LSTM Options
layers = [ ...
sequenceInputLayer(Features)
lstmLayer(HiddenUnits)
fullyConnectedLayer(Responses)
regressionLayer];
options = trainingOptions('sgdm', ...
'Momentum', .5, ...
'MaxEpochs',250, ...
'GradientThreshold',1, ...
'InitialLearnRate',0.005, ...
'LearnRateSchedule','piecewise', ...
'LearnRateDropPeriod',125, ...
'LearnRateDropFactor',0.2, ...
'Verbose',0, ... 'Plots','training-progress');
% Train model
net = trainNetwork(XTrain,YTrain,layers,options);
Predicting with our model
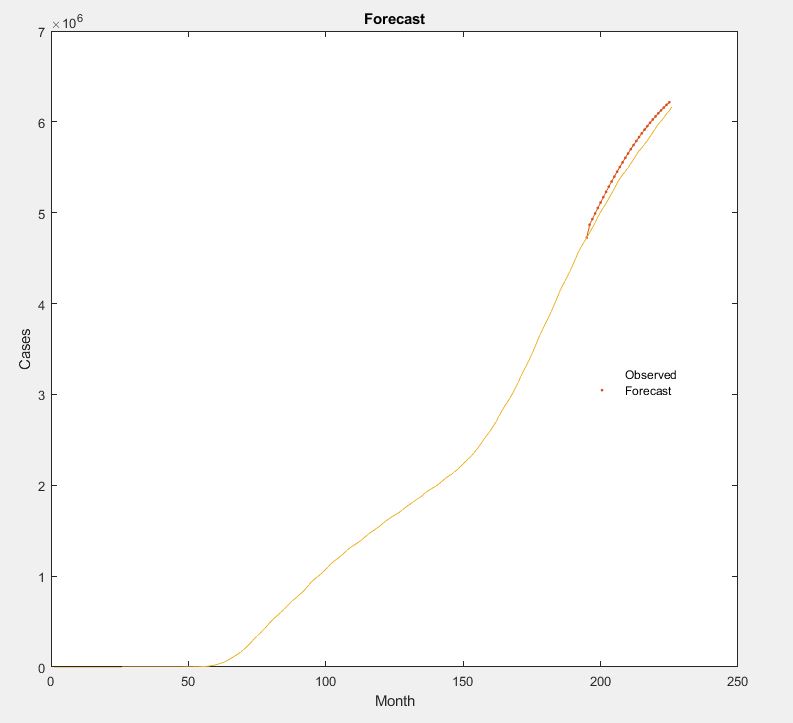
Now that the network is trained, it's time to make a prediction for the dates from 9/3/20 to 10/4/20. As from before, we have standardized the testing data input. After the first day's prediction, we are using that output as an additional input into the network. When we get to the 30th day, there will be 30 inputs inside the original network. We plot the Covid 19 predictions compared to the actual measurements. With the difference between these two, we can see the overall prediction accuracy.
% Forecasting
dataTestStandardized = (TestingData - mu) / sig;
XTest = dataTestStandardized(1:end-1);
net = predictAndUpdateState(net,XTrain);
[net,YPred] = predictAndUpdateState(net,YTrain(end));
numTimeStepsTest = numel(XTest);
for i = 2:numTimeStepsTest
[net,YPred(:,i)] = predictAndUpdateState(net,YPred(:,i-1),...
'ExecutionEnvironment','cpu');
end
YPred = sig*YPred + mu;
YTest = TestingData(2:end);
rmse = sqrt(mean((YPred-YTest).^2));
figureplot(TrainingData(1:end-1))
hold on
idx = TimeStepsTrain:(TimeStepsTrain+numTimeStepsTest);
plot(idx,[CovidData(TimeStepsTrain) YPred],'.-')
hold on
plot(CovidData)
hold off
xlabel("Month")
ylabel("Cases")
title("Forecast")
legend(["Observed" "Forecast"])
diff = abs(YTest - YPred);
perc = diff ./ (YTest) .* 100;
figure
plot(perc)
title("Percentage Errors")
xlabel("Day of Forecast")
perc_accuracy = 1 - mean(perc);
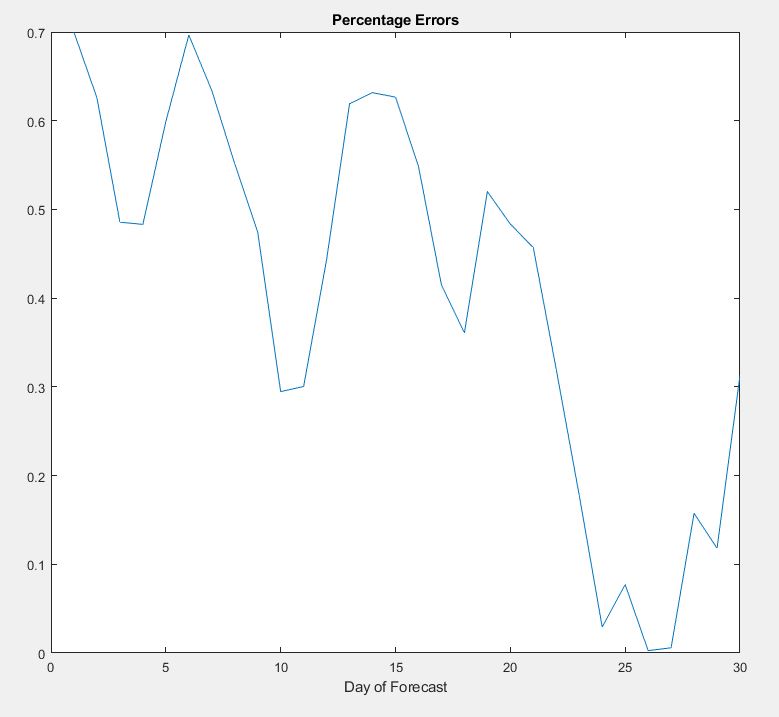
We are getting a prediction accuracy of 99.5% using the LSTM Model via MATLAB. With the predictions made further out, the overall accuracy should be getting worse due to the gain caused by errors being input into the
consecutive days. Currently in the U.S.A, we are seeing another rapid gain in Covid-19 cases. With the usual 1-2 weeks of lead up time before a new individual tests positive, there may be a lag shown in the most
recent data compared to the prediction. The model may be predicting over what was measured near the end of the prediction month. We see a decreased accuracy because the measured cases are spiking.
However, this is still great news for testing the strength of our model as we are aware at how overqualified the LSTM network is for this data set. With only a single input, the data is fairly easy for the model to
characterize and make a prediction. For further work, we want to add additional input features or find a more local data set such as the number of cases in a specific city. We may be able to see the effects of
certain outside factors such as mask policies. We are excited to continue our learning of machine learning methods and applications. Stay tuned for further updates in the near future and thank you for reading our
articles.
Feel free to connect with us on linkedin and stay tuned for our next series where we will explore predicting covid-19 cases with LSTM.
Yukon Peng https://www.linkedin.com/in/yukpeng/
Mario Gonzalez https://www.linkedin.com/in/mag93/
Bhanu Garg https://www.linkedin.com/in/bhanu-garg-084bb5102/
Nathan Blackmon https://www.linkedin.com/in/nathan-blackmon-3b917219b/